Stock market action bolsters case for a top.

The tide is turning. We now have a strong, impulsive decline off the highs, confirmed by a rise in the dollar and declines in the metals, energy, and grains. Yes, we’ve seen this before (in June, August and September), but the sustained manic conditions (put/call ratio, DSI, etc) that we saw in mid-September and mid-October are unlikely to be revived. When momentum runs out and there are no fundamentals to offer support, stocks can fall under their own weight. They don’t need a catalyst.

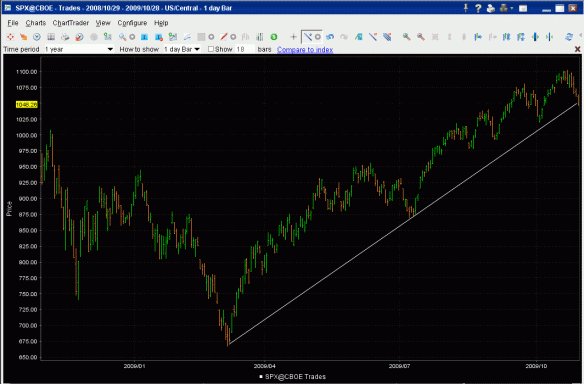
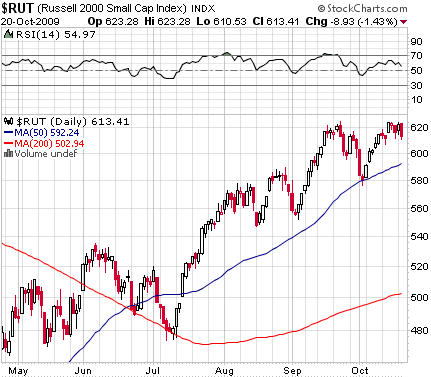
The Russell 2000 (like the SPX and Nasdaq) has just busted through its big support line drawn from the March lows to the July lows:

Source: Interactive Brokers

The SPX (S&P 500) has put a toe over the same line, while the Dow has a bit to go. Here’s the SPX:

-

Things are looking very bearish intermediate-term, but for the next day or two, I think the odds favor a small bounce. We’ve had two strong weeks of declines, and the overbought, over-bullish condition is cleared for now. I’m long stock futures (and a touch of oil and gold) from today’s lows to hedge my put position. Positioned like this, I get no benefit from further declines, and preserve equity to re-short any rally.

Remember, if this decline resembles that of ’30 or ’37, ALL of this year’s gains could be wiped out in a mere three months. If this is wave 3, it could be much faster than wave 1 (Oct 2007 – March 2009). It marks the start of the worst part of the depression. If you know anyone who owns stocks or is thinking of getting back in, implore them to seek safety (Treasury-only money market funds). Likewise, right now may be the last chance in 20 years to unload real estate at 2003 prices.

List of Texas ratios for all US banks

Just in time for failure Friday, Chris Bruner has assembled a list of Texas ratios for all US banks. This data is all publicly available, but is not often assembled in one place. This is a large html file, posted here on Lew Rockwell’s server. It can be searched using the keyboard command Control-X. The data is as of Q2 2009. From Wikipedia:

The Texas ratio is a measure of a bank’s credit troubles. Developed by Gerard Cassidy and others at RBC Capital Markets, it is calculated by dividing the value of the lender’s non-performing assets (Non performing loans + Real Estate Owned) by the sum of its tangible common equity capital and loan loss reserves.

Banks with ratios of 100 or higher are often considered very likely to fail soon, and those with scores of over 50 are sometimes considered risky.

The banking system is in much worse shape today than 12 months ago, with default rates up and collateral values down across the board. Loan loss reserves are absolutely pathetic relative to non-performing loans:

Source: St. Louis Fed

Remember that bank failures did not end with the crash of 1929, but continued to pick up steam into the 1930s, culminating in Roosevelt’s bank holiday in the spring of ’33, in which he stole the citizens’ gold and devalued the dollar. The Dow bottomed in July ’32 and had already doubled by then.

Update: Failed banks announced

Here are the losers this week, and their respective Texas ratios:
Partners Bank, Naples, FL (393)
American United Bank, Lawrenceville, GA (161)
Hillcrest Bank Florida, Naples, FL (286)
Flagship National Bank, Bradenton, FL (259)
Bank of Elmwood, Racine, WI (180)
Riverview Community Bank, Otsego, MN (238)

Some crude charting

Here’s a 1-month view of the Nymex December light sweet crude contact:

Source: Interactive Brokers

Watch for a break of that trendline. With bullishness running at 95% (and 97% on gasoline and heating oil), this rally must be getting long in the tooth. Also note that the rally has stalled against a longer-term channel trendline (see 1-year chart below). This week’s highs could make for a nice stop for a short position.

Source: Interactive Brokers

Don’t underestimate crude’s ability to levitate even if stocks begin to fall. This is just what happened in 2008 of course. Oil and other commodities charged ahead even as demand fell apart and deflation (a contraction of money + credit) took hold.

Also watch copper, which has been tracking oil pretty closely lately. Bullish readings aren’t as high here, so it may have even further to run:

Source: Interactive Brokers

The target here would be about $3.35-3.40 if copper hits the upper trendline. Given modest bullishness readings, there are enough traders to convert to the bull side for this to happen. Of course, a strong turn down in equities and move up in the dollar, should they come to pass, would be a headwind for all commodities.

Toppy action today: bulls ready to stampede?

Today’s action reminded me of the trading on Sept 23, with a ramp up followed by a swan dive in the late afternoon. Traders will remember the 23rd as the Fed Wednesday that marked the top prior to the 5% sell-off into the first week of October. Here’s a 1-week view of the Russell 2000 futures:

Source: Interactive Brokers, LLC

We’ve now had 6-7 days of mostly sideways action on very high DSI and very low Put:Call readings, indicating persistent bullishness and complacency in the face of stagnating prices.

The market the last several days has been lead by the big tech names, the same stocks that charged ahead just as the market topped in October 2007.

Interestingly, gold has not sold off hard with stocks. I’ve just gone long a touch of gold and silver futures as a hedge to my stock futures shorts, since sentiment there is not extreme at present and the metals usually terminate in spikes, not rolling tops like they have formed recently. I remain bearish gold and silver on a multi-month time frame.

We’re probably at another top; the question is what kind

I’m again very bearish short-term, basically taking the approach that we’re topping until proven otherwise. I think we’re about to roll over like we have three times since early August. Indicators show that each recovery since then has further disheartened the bears and encouraged the bulls, which is as it should be, making each top more likely the final top. It’s a process: the market shakes out as many players as possible, so that the fewest number of bulls and bears benefit.

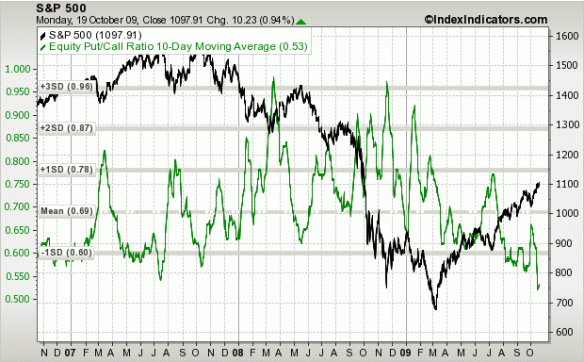
I’ll start as I often do, with the equity put/call (10-day average) vs. SP500:

-

Take a look at the similarity between the CPC and price action from January to July ’07 and that of May ’09 to today, and note the last time the 10-day average dipped below 0.55: July ’07.

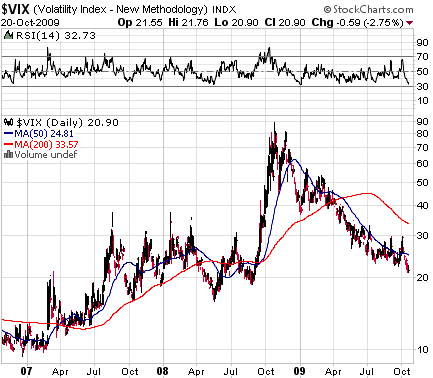
The VIX is also indicating complacency, with its RSI well into “oversold” territory:

-

I’m also noting the relative weakness of the Russell 2000 and Nikkei in this latest push upwards. The Russell has only recovered back to its September highs, lagging the SPX and NDX, and the Nikkei remains well below its August levels (as does Shanghai, which topped in early August):

-

-

Multiple signs are pointing to an equity sell-off dead ahead (starting this week or next), probably at least of the magnitude of that in July-August 07 or June-July 09, which means 10%, more or less.

Whether we then recover to chop around up here another few weeks like in Sept-Oct ’07 or fall straight down like 1930 and 1938 is anyone’s guess, but CPC, VIX, DSI and Treasuries all say there could be a major top in this vicinity. For an indication of what support follows that top, you can look at technicals and  fundamentals. The first major technical support is the SPX 900-950 area, where we peaked in January and June ’09 (and bottomed in Sept ’01), followed by 750-800 (bottom in Oct-Nov ’08 and Oct ’02 and March ’03), and then of course 666.

-

Fundamentally, there is no value above SPX 450, a humdrum 11.25X multiple on expected 2009 earnings. Contrary to popular belief, $40 in earnings is not at all a depressed level relative to the last 15 years, but only compared to the very peak of the bubble in ’04-’07. At 450, the market would yield a bit under 5% on today’s dividends (which are still being cut and are only at 2005 levels). A 5% yield would be no huge bargain, but a lot better than the 2% investors are getting today.

For an indication of how quickly parties like this can end, take a look at what happened to the Brazilian stock market today:

-

This US-traded Brazil ETF was down over 6% before noon today, leaving the previous four trading days as an island top. (I am short Brazilian stocks and the currency.)

If the US market does roll over here by 100 SPX points or so, keep an eye on the put:call ratio. I’ll be ratcheting down stops and very wary of a retest once the 10-day average gets a standard deviation above the mean (we must be 2 SDs under it right now). That said, it wouldn’t do to get stopped out on a 30% retracement only to see the market make an Acapulco cliff dive like in ’87, ’29, ’30 or ’38 as the crowd realizes that things have only gotten worse since last year. If this turns out to be a big third wave, it could take us straight to the March lows three months after the peak.

Doug Casey and Tom Woods on government

Video link from Lewrockwell.com

Here’s an excerpt from The Law, by Frederic Bastiat, a French classical liberal (today we would say libertarian) economist:

A Fatal Tendency of Mankind

Self-preservation and self-development are common aspirations among all people. And if everyone enjoyed the unrestricted use of his faculties and the free disposition of the fruits of his labor, social progress would be ceaseless, uninterrupted, and unfailing.

But there is also another tendency that is common among people. When they can, they wish to live and prosper at the expense of others. This is no rash accusation. Nor does it come from a gloomy and uncharitable spirit. The annals of history bear witness to the truth of it: the incessant wars, mass migrations, religious persecutions, universal slavery, dishonesty in commerce, and monopolies. This fatal desire has its origin in the very nature of man — in that primitive, universal, and insuppressible instinct that impels him to satisfy his desires with the least possible pain.

Earnings check: quietly revising down

Here’s a snapshot from the latest S&P 500 earnings file (paste the following link into your browser or google “S&P 500 earnings” for the whole Excel file: www2.standardandpoors.com/spf/xls/index/SP500EPSEST.XLS):

.

.

.

.

.

.

.

.

.

.

.

.

.

.

.

.

.

.

The average estimate for 2009 earnings is now under $40 (for a PE of 27 using today’s price), since Q3 and Q4 have been revised way down from earlier this year. Now analysts think Q4 could only come in $1 better than Q1, which was horrible.

These numbers make you wonder if accountants used up all of their tricks to boost the bottom line in Q2. The reality of shrinking sales and margins can’t be hidden forever.

The estimates for 2010 and 2011 earnings are now $45 and $61, respectively, and 2009 dividends are projected at $22 (back to 2005 levels from $28 in 2008, for a piddling 2% yield). Even if profits recover as projected, the market will have to maintain the current extreme multiple in order to deliver gains over the next two years. We are already trading at 18X 2011 earnings! The PE at the peak in 2007 was 19, and look at where that got us.

My own take on earnings is that we will be lucky to see $30 in 2010 or 2011 for that matter. The debt overhang remains, and underlying asset values are so much lower than they were 12 months ago that another huge round of write-offs is needed, which will directly hit the bottom line. Households are digging in, and banks are still pulling in credit. The consumer economy is not coming back, and corporate America will take years to adjust.

Stock prices are so far from fundamental support of any kind that this market has to be counted among the greatest bubbles of all time. Many observers understand that this is a bubble, and are wondering what it will take to bring prices back in touch with reality. My answer is nothing — the market will simply turn with social mood, which has no master but god. The facts are always there, but traders aren’t always in the mood to check.

-

Chart roundup

Greetings from the USA. I’ve been on the move and under the weather (why is it I only get colds in the US?) for a couple of weeks.

Here’s an old standby, 20-day average equity Put:Call vs. S&P500. As you can see, extreme readings are a very powerful indicator, but the market can take its time in responding, as it is now:

-

The action these days reminds me of May-July 2007, with its extreme optimism, complacency and overvaluation. Remember how quickly things cracked in late July and August, when we went from Goldilocks to Cramer’s famous (and probably scripted) tantrum about how Bernanke needed to lower rates?

Here’s another chart I’m watching. Would you sell it short?

-

The VIX has printed a new low, but its slope is flattening out:

-

One measure of risk is not registering new extremes, the Gold:Silver ratio:

-

Here’s TLT (30 year bond proxy) priced in gold. I’m not saying it’s definitely printed a bottom, but I wouldn’t short this:

-

I gather people are starting to fret about gasoline prices again. I’m not worried, since sentiment is getting pretty lopsided even as prices fail to register new highs:

-

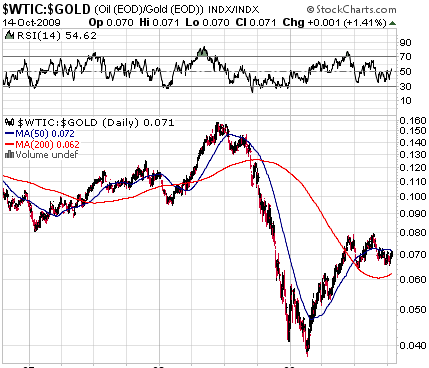
To filter out the reflation effect, here’s crude oil priced in gold. It has done all it needs to clear the oversold condition, with a kiss of 0.08, last seen in early 2007:

-

Dr. Copper’s also all cleared for a fall:

As for the funnymentals, revenues and earnings are still way down from Q3 2008, which was already well into the recession. Quarter over quarter improvements in operating earnings mean nothing without revenue growth, and pricing power is shot. Analyst estimates assume a return to peak earnings within two years, which is insane, since the credit bubble that produced those numbers is not coming back. Credit of every kind is still shrinking. Bank credit just went negative for the first time since the Fed started keeping track in 1974:

-

This remains a technical rally, a relief of universally bearish sentiment that has turned into a momentum-driven, low-volume, low-participation mini-mania. When the momentum runs out, there won’t be a bid to stop the fall for hundreds of S&P points.

We’ve been at peak conditions for about two months now, in terms of the VIX, put:call and sentiment surveys, and prices have fulfilled all kinds of technical targets. What can’t be sustained, won’t.