Watch out for the dollar

-

UUP (dollar bull ETF) and SPY:

-

Bonds were also up today, of course. Given the extreme degree of consensus we saw during the latest highs in stocks and lows in the dollar, today’s rally could be nothing more than a standard correction (at 40-odd percent, that is all the retracement is so far). It was to be expected (I went long SP futures and QLD Friday to hedge dollar longs and my equity and silver options). The test is whether we break to new highs on new reflation impulses. Precious metals, copper, oil, bonds and currencies say, “don’t press your luck.”

Make it a real audit, then end the Fed

Thomas Woods, Jr., PhD, Prepared Testimony in Support of HR 1207, The Federal Reserve Transparency Act of 2009, House Financial Services Committee, September 25, 2009:

There is no good reason for Americans not to know the recipients of the Fed’s emergency lending facilities. There is no good reason for them to be kept in the dark about the Fed’s arrangements with foreign central banks. These things affect the quality of the money that our system obliges the American public to accept.

The Fed’s arguments against the bill are unlikely to persuade, and will undoubtedly strike the average American as little more than special pleading. Perhaps the most frequent of the claims is that a genuine audit would jeopardize the alleged independence of the Fed. Congress could come to influence or even dictate monetary policy.

This is a red herring. The bill is not designed to empower politicians to increase the money supply, choose interest-rate targets, or adopt any of the rest of the Fed’s central planning apparatus, all of which is better left to the free market than to the Fed or Congress. It seeks nothing more than to open the Fed’s books to public scrutiny. Congress has a moral and legal obligation to oversee institutions it brings into existence. The convoluted scenarios by which merely opening the books will lead to an inflationary catastrophe at the hands of Congress are difficult to take seriously.

At the same time, as we hear this objection repeated time and again, we might wonder just how independent the Fed really is, what with its chairman up for reappointment by the president every four years. Have these critics never heard of the political business cycle? Fed chairmen have been known to ingratiate themselves into the president’s favor close to election time by means of loose monetary policy and the false (and temporary) prosperity it brings about. Let us not insult Americans’ intelligence by pretending this phenomenon does not exist…

If there is any truth to the idea of Fed independence, it lay in precisely this: the Fed may reward favored friends and constituencies with trillions of dollars in various kinds of assistance, while keeping the public completely in the dark. If that is the independence we’re talking about, no self-respecting American would hesitate for a moment to challenge it.

A related argument warns that the legislation threatens to politicize lender-of-last-resort decisions. Again, this is untrue. But even if it were true, how would that represent a departure from current practice? I hope we are not asking Americans to believe that the decisions to bail out various financial institutions over the past two years, and in particular to allow them to become depository institutions overnight that they might qualify for assistance, were made on the basis of a pure devotion to the common good and were not political at all. Most Americans, not unreasonably, seem convinced of another thesis: that Goldman Sachs, for instance, might be just a little bit more politically well connected than the rest of us…

If our monetary system were really as strong, robust, and beyond criticism as its cheerleaders claim, why does it need to rely so heavily on public ignorance? How can it be a sound banking system that depends on keeping the public in the dark about the condition of its financial institutions?

Let me also make clear that supporters of this legislation are strongly opposed to a watered-down version of the bill – which, incidentally, would only increase public suspicion that someone is hiding something.

If the Federal Reserve Transparency Act passes and the audit takes place, the American people will have achieved a great victory. If the legislation fails, more and more Americans will begin to wonder what the Fed could be so anxious to keep hidden, and the pressure for transparency will simply intensify. A recent poll finds 75 percent of Americans already in favor of auditing the Fed. The writing is on the wall.

The Federal Reserve may as well get used to the idea that the audit is coming. That would be a far more sensible approach than the counterproductive and condescending one it has adopted thus far, in which the peons who populate the country are urged to quit pestering their betters with all these impertinent questions. The Fed should take to heart the words of consolation the American people are given whenever a new government surveillance program is uncovered: if you’re not doing anything wrong, you have nothing to worry about.

The superstitious reverence that Americans have been taught to have for the Federal Reserve is unworthy of the dignity of a free people. The Fed enjoys a government-granted monopoly on the creation of legal-tender money. It is not an unreasonable imposition for Americans to demand to know about the activities of such an institution. It is common sense.

Tom Woods (see his website) is a senior fellow at the Ludwig von Mises Institute, the premier libertarian thinktank (Cato sold out decades ago after they got rid of Murray Rothbard).

Valuation still matters

Many great traders could care less, but investors need value, and there has been none in the US stock market as a whole since about the early 1990s, and no great value since about 1984. Value means getting a lot for your money, and in stocks that means of course earnings, dividends and (honestly priced) assets.

David Rosenberg is about the only bearish mainstream economist left, all the others having drunk too much Keynesian cool-aid and succumbed to the fallacy that Fed printing and government spending is stimulative (is is the opposite). In this morning’s Breakfast with Dave he warns again that fundamental or long-term investors have business touching the stock market at these prices:

WAY TOO MUCH RISK IN THE EQUITY MARKET

Never before has the S&P 500 rallied 60% from a low in such a short time frame as six months. And never before have we seen the S&P 500 rally 60% over an interval in which there were 2.5 million job losses. What is normal is that we see more than two million jobs being created during a rally as large as this.

In fact, what is normal is for the market to rally 20% from the trough to the time the recession ends. By the time we are up 60%, the economy is typically well into the third year of recovery; we are not usually engaged in a debate as to what month the recession ended. In other words, we are witnessing a market event that is outside the distribution curve.

While some pundits will boil it down to abundant liquidity, a term they can seldom adequately defined. If it’s a case of an endless stream of cheap money, we are reminded of Japan where rates were microscopic for years and the Nikkei certainly did enjoy no fewer than four 50% rallies and over 420,000 rally points in a market that is still more than 70% lower today than it was two decades ago. Liquidity and technicals can certainly touch off whippy tradable rallies, but they don’t take you all the way to a sustainable bull market. Only positive economic and balance sheet fundamentals can do that.

Another way to look at the situation is that when you hear and read about “liquidity” driving the market, it is usually a catch-all phrase for “we have no clue” but it sounds good. When we don’t have a reasonable explanation for what is driving prices our strategy is to watch from the sidelines and express whatever positive views we have in the credit market and our other income and hedge fund strategies.

I wholeheartedly agree with his take on the word liquidity as it is thrown about these days. All it really seems to mean is that people are bullish and in the mood to take on risk — most assets were perfectly liquid throughout the crash (that is, there were plenty of buyers), packaged mortgage debt included. The banks only pretended their assets were unsaleable because they didn’t like the bids, which, as it turns out, were perfectly reasonable given the reality of default rates and shrinking collateral values.

Rosenberg goes on to discuss exactly how ridiculous the valuations are, even given the extremely rosy earnings forecasts, which seem to imply that Goldilocks was only taking a little nap and that it is not true that she was torn to shreds by the bears:

As for valuation, well let’s consider that from our lens, the S&P 500 is now priced for $83 in operating EPS (we come to that conclusion by backing out the earnings yield that would match the current inflation-adjusted Baa corporate bond yield). That would be nearly double from the most recent four-quarter trend. Not only that, but the top-down estimates on operating EPS, for 2009 are $48.00 for 2009; $52.60 for 2010; $62.50 for 2011; and $81.00 for 2012. The bottom-up consensus forecasts only go to 2010 and even for this usually bullish bunch, operating EPS is seen at $73.00 for 2010, which means that $83.00 is likely a 2011 story. Either way, the market is basically discounting an earnings stream that even the consensus does not see for another two to three years. In other words, this is more than just a fully priced market at this point.

It is, in fact, deeply overvalued at this juncture. Imagine that six months after the depressed lows we have a situation where:

The trailing price-earnings ratio on operating EPS is 26.5x. At the October 2007 highs, it was 18.8x. In addition, when the S&P 500 is trading north of a 26x P/E multiple on trailing operating earnings, history shows that at these high valuation levels, the market declines in the coming year 60% of the time.

The trailing price-earnings ratio on reported EPS is 184.2x. At the October 2007 highs, it was 23.4x. In fact, just prior to the October 1987 crash, the P/E ratio was 20.3x (not intended to scare anyone).

The price-to-dividend ratio is 53x, where it was at the 2007 highs. Again, the market is trading as it if were at a peak for the cycle, not any longer near a trough. Once again, and we don’t intend to sound alarmist, the price-to-dividend ratio just prior to the 1987 crash was 12x, and at the time, the S&P 500 was viewed in many circles to be at an extended extreme.
Bullish analysts like to dismiss the actual earnings because they are “depressed” and include too many writeoffs, which of course will never occur again. Fine, on one-year forward (operating) earning estimates, the P/E ratio is now 15.7x, the highest it has been in nearly five years. At the peak of the S&P 500 in the last cycle — October 2007 — the forward P/E was 14.3x, and the highest it ever got in the last cycle was 15.4x. So hello? In just six short months, we have managed to take the multiple above the peak of the last cycle when the economic expansion was five years old, not five weeks old (and we may be a tad charitable on that assessment). As an aside, the forward multiple on the eve of the 1987 stock market collapse was 14x and one of the explanations for the steep correction was that equities were so overvalued and overbought that it was vulnerable to any shock (in that case, it came out of the U.S. dollar market). It certainly was not the economy because that sharp 30% slide took place even with an economy that was humming along at a 4.5% clip.

The entire article (sign up for emails) is worth a read. There is much more good stuff in there on housing, manufacturing, commodities and household net worth. Savvy contrarian that he is, he also had these kind words to say about the US dollar:

We do not like the U.S. dollar at all, but at the same time, from a purely tactical standpoint, we have to recognize that there are no U.S. dollar bulls out there right now, the bearish dollar trade is the crowded consensus trade, and that the greenback is massively oversold. It could snap back near-term — be aware of that, please.

Gold:Silver ratio approaches support

The relative values of gold and silver are a measure of risk aversion, akin to the VIX. Silver is largely an industrial metal and reflects appetite for commodities in general, whereas gold is owned as hard cash for safety.

Witness the premium silver fetched in the commodities mania of 2007 to July 2008, and the soaring value of gold in the panic last fall. Like the VIX, it registered a peak in October and November and did not confirm the equity lows in March. There is also a correlation in recent months between Gold:Silver and the US dollar index (only 3% bulls there yesterday, by the way).

We’re now a few points above a level where two major trend lines intersect, though the RSI and MACD are already in oversold territory. A quick, terminal spike in silver would complete the pattern nicely:

-

Readers know that I am a stomping dollar bull and precious metals bear at the moment. Gold bugs, take a chill pill — I’m all for a gold standard, and yes, gold will continue to outperform most other assets in this depression, but that doesn’t mean the metals aren’t overbought like everything else in this reflation/recovery mania. Possible spike tops notwithstanding, I expect both silver and gold to fall from here, and for silver to fall harder. I expect $14 within 6 weeks, followed by $12 early next year, and possibly even $8 in a year or two.

Long live the dollar!

Dollar index here, with my annotations of readings in the Daily Sentiment Index (trade-futures.com) at extremes and turning points:

Dollar chart from Stockcharts.com

Clusters of low-mid single digit readings are very rare and very bullish. You all know what it means for stocks when the dollar makes a big break upwards.

For good measure, here’s the 3-year chart of the S&P versus the 20-day average equity put:call ratio:

Source: indexindicators.com

-

Remember my mention the other day of a possible bullish breakout in grains? Corn, wheat and oats all had fantastic days. I was in wheat, for a 4% day. Here’s corn, with its 9% move:

Source: futures.tradingcharts.com

5th Avenue blues

Hat tip Evilspeculator

They counted 48 vacant properties (I presume mostly street-front) from 59th to 14th Streets on 5th Avenue in Manhattan. I don’t have any stats to compare this to, but it is clear that times are not so good for landlords (and their banks) in NYC. I used to live on the same block as one very large storefront shown here, and I happen to know that that particular property has been vacant for over 18 months, ever since its former tenant, a nationwide retail chain, went bankrupt.

I have noticed that many of the “for rent” signs you see in Manhattan bear the name of Vornado or other such REITs. That sector is still doomed, though traders seem to have forgotten to ask, “where’s the equity?” I suspect that in most cases, an honest accounting would reveal that net of debt and marked to market, there is none at all.

She’ll be comin’ round the corner when she comes…

Here’s a roundup of the usual markets, plus a look at grains. This topping process is frustrating, but the action remains encouraging for those waiting to profit from a resumption of the deflation trade. Even as some stock indexes make new highs, they have been revealing their weakness with low volume and advance/decline ratios. The currency and metals markets are signaling exhaustion, and Treasuries have refused to participate in this summer’s nonsense. To the charts:

The dollar to stock inverse relationship is still strong:

-

With only a few % of traders (DSI) bullish on the dollar and about 90% bearish on stocks last week, and respective 20-day averages similarly extreme, a big reversal is imminent. We first entered this condition in early August, and we have not had a significant correction to relieve it, but it has grown even more extreme, so when the break comes it is likely to be very large. My theory is that the more extreme sentiment gets, the sharper the reversal, and the longer extremes are maintained, the larger the degree of that move.

From a trading perspective, I prefer dollar longs (via euro, pound, CAD and AUD shorts) and gold and silver shorts as optimal short-term plays right now. This is where the single-digit DSI readings and exhaustive spikes are to be found. Short entries from this level allow for tight and well-defined stops.

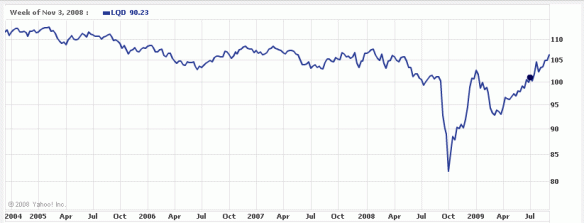
Risk appetite remains very robust across the board, with investment-grade corporate bonds back to the kinds of yields we saw near the peak of the credit bubble. Here is the LQD ETF:

-

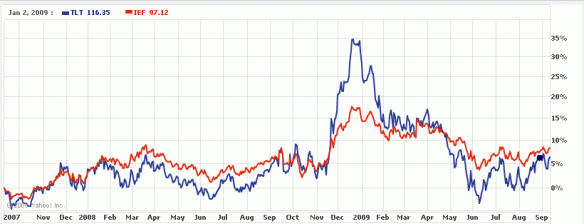
The above is sure to end very badly, since corporate revenues are off a whopping 25% since last year.  Treasury traders are holding up a big red flag and are not participating in this summer’s risk binge, but keeping a steady bid under the entire yield curve. Bonds made their bottom in June (TLT and IEF here — 30 and 10 year proxies, respectively).

-

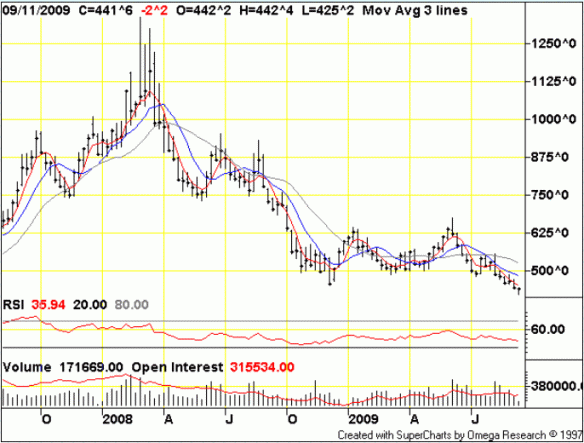
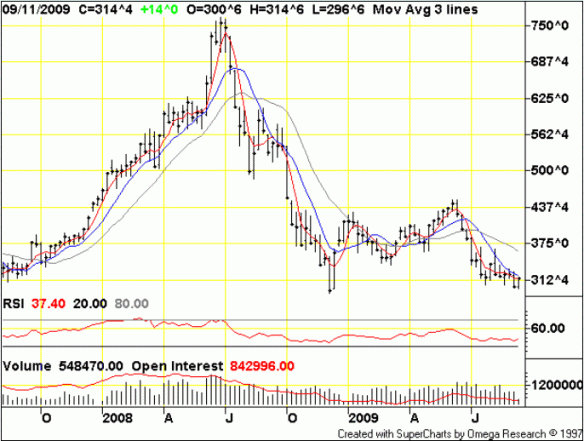
I almost never mention the agriculture markets, but I have been watching them all summer, and I think there may be an opportunity coming up for a short-term play on the long side of grains. Wheat, corn and oats have been in a downtrend for much of the last two years, and their slides may be approaching termination as DSI readings enter the 7-18% range. This is similar, though not yet as extreme as what occurred in the natural gas and hogs markets recently, and those went on to violently reverse to the upside. The grain charts are not yet as pretty as those, and sentiment has some room to allow for an exhaustive plunge, but if it happens that would be a very nice buying opportunity, especially if we get a few consecutive days of single-digit readings. Here’s a weekly chart of wheat, my favorite:

source: http://futures.tradingcharts.com/chart/ZW/W

Corn here:

-

That about wraps it up. In summary, I’m feeling good about my long-term equity puts, but even more excited about the set-up in the currency and precious metals markets. I always like to able to go long something relatively uncorrelated, so it’s nice when a random commodities like grains provide such an opportunity.

Spontaneous Jubilee in the air?

Why shouldn’t someone walk away from overbearing consumer, student or mortgage debt, so long as it is non-recourse? I can’t think of any reason to keep servicing debt if you have no hope of repaying the principal. What good is a high FICO score if you don’t want to run up another credit card balance or buy a home? Yes, landlords run credit checks, but it is getting harder and harder to fill vacancies, and this is what deposits are for anyway.

The “just walk away” attitude is gaining traction.  It could snowball into next year as yet more mortgages reset and U-3 unemployment enters the double digits. What can the legal system do if tens of millions of people decide to stop paying their unsecured loans? This lady is right — there is safety in numbers and government inefficiency. You get a fresh start in five years anyway, which should be right around the time real estate has a chance of recovering.

This is exactly what needs to happen. The unpayable debt will by definition be defaulted on, so the sooner the better. The banks that issued it need to go under. Stories like this are refreshing, because we need to clear the air.

Rosenberg: Latest employment and credit figures show deflationary depression unabated

This morning’s Breakfast With Dave is good one.

There are so many headwinds confronting the U.S. consumer it’s not even funny. For a look at the new harsh reality of soaring usage of grocery vouchers, as well as other supplements to the household budget, have a look at the grim article on page 2 of the weekend FT (Families Take Up Food Stamps as Wages Shrink). On the very same page, there is an article on the latest trend in terms of 21st-century breadlines — Middle Classes Turn to Car Park Handouts. To think we still get asked why we aren’t more bullish over the outlook for spending. Truly amazing.

TREMENDOUS UNDEREMPLOYMENT

The U.S. economy is actually 9.4 million jobs short of being anywhere remotely close to being fully employed, which is why any inflation that can somehow be created by the Fed is simply going to be unsustainable noise along a fundamental downtrend in pricing power. After last Friday’s report, we have now lost 6.9 million positions that have been cut during this recession and we have to count in the additional 2.5 million jobs that need to be created — but never were — just to absorb the new entrants into the labour market. The ‘real’ unemployment rate is now 16.8%, so to suggest that this down-cycle was anything but a depression is basically a misrepresentation of the facts.

MONEY AND CREDIT AGGREGATES ARE NOW DEFLATING

It is interesting that the equity market has begun to wobble (fade last Friday’s rally on such low volume) because we have noticed that some key liquidity indicators are not behaving very well, all of a sudden. M1 fell 1.0% in the August 24th week and over the past four weeks is down at a 6.5% annual rate. M2 has contracted in each of the past four weeks too and over that time has slipped at a 12.2% annualized pace, which is a near-record decline. We see the same trend in the broad MZM money measure — off at a 15.8% annual rate over the past month. Bank credit also remains in a fundamental downtrend — contracting at an epic 9% annualized pace over the past four weeks.

So for the first time in the post-WWII era, we have deflation in credit, wages and rents, and from our lens this is a toxic brew that in the end will ensure that the focus on capital preservation and income orientation will be the winning strategy over a strict reliance on capital appreciation.

Liquidity is a state of mind

Quickie post here.  Check out Daneric’s post on the nature of this thing people like to call liquidity.

People and media in general like to use the term liquidity. You here things like “its all about liquidity and liquidity moves the markets” or some such dictum. Or “High Frequency Trading” provides liquidity. Or the choking of liquidity is a therefore a “credit crisis”. You here media stories talking about it all the time as if “liquidity” is a living thing in and of itself!

But what does it really mean?

What is liquidity? Breaking it down to its most basic definition I googled the term several times and came up with this: “Market liquidity refers to an asset’s ability to be easily converted through an act of buying or selling without causing a significant movement in the price and with minimum loss of value. Money, or cash on hand, is the most liquid asset. “

Sounds ok and something CNBC would approve of (the minimal loss of value part). But is that a truthful or useful definition? Is liquidity a natural occurring substance that can be harnessed or controlled for the good of mankind? Can we drill for liquidity in deep reservoirs under the ocean and provide economic benefit for all? Of course not!

(Ok Dan just get to the point!) I came up with my own set of definitions for liquidity:

1) Liquidity is the easy flow of assets, fiat money and credit from one entity (person) to another.
2) Liquidity in the 21st century is mostly the result of the creation and flow of credit.
3) Liquidity is a state of mind.
.
I wholeheartedly agree with this perspective:
So that is what bonkers (sic) me sometimes when I hear that term “liquidity” and how it is used. The term has become a placeholder for social mood. An excuse. Saying things like “The market crashed because liquidity dried up in a credit crisis is akin to saying, “The dog ate my homework”.